How to Measure Social Media Storytelling Impact
How to Measure Social Media Storytelling Impact
Are your social media stories driving results? Tracking performance is essential to ensure your efforts translate into meaningful outcomes like engagement, trust, and revenue. Here's what you need to know:
- Storytelling builds trust: 81% of consumers need to trust a brand before making a purchase.
- Results are possible on a budget: A small business spent $3,600 on storytelling through podcasts and generated $234,000 in revenue.
- Key metrics to track: Focus on awareness (reach, impressions), engagement (comments, shares, saves), conversions (CTR, sales), and sentiment (positive or negative emotions).
Top Social Media Metrics to Analyze and How to Measure Them Effectively 📚
sbb-itb-63525a7
Key Metrics for Social Media Storytelling
Vanity metrics might look good on paper, but they don't tell the full story. The numbers that truly matter tie directly to business goals - whether that's raising awareness, sparking meaningful conversations, or driving revenue.
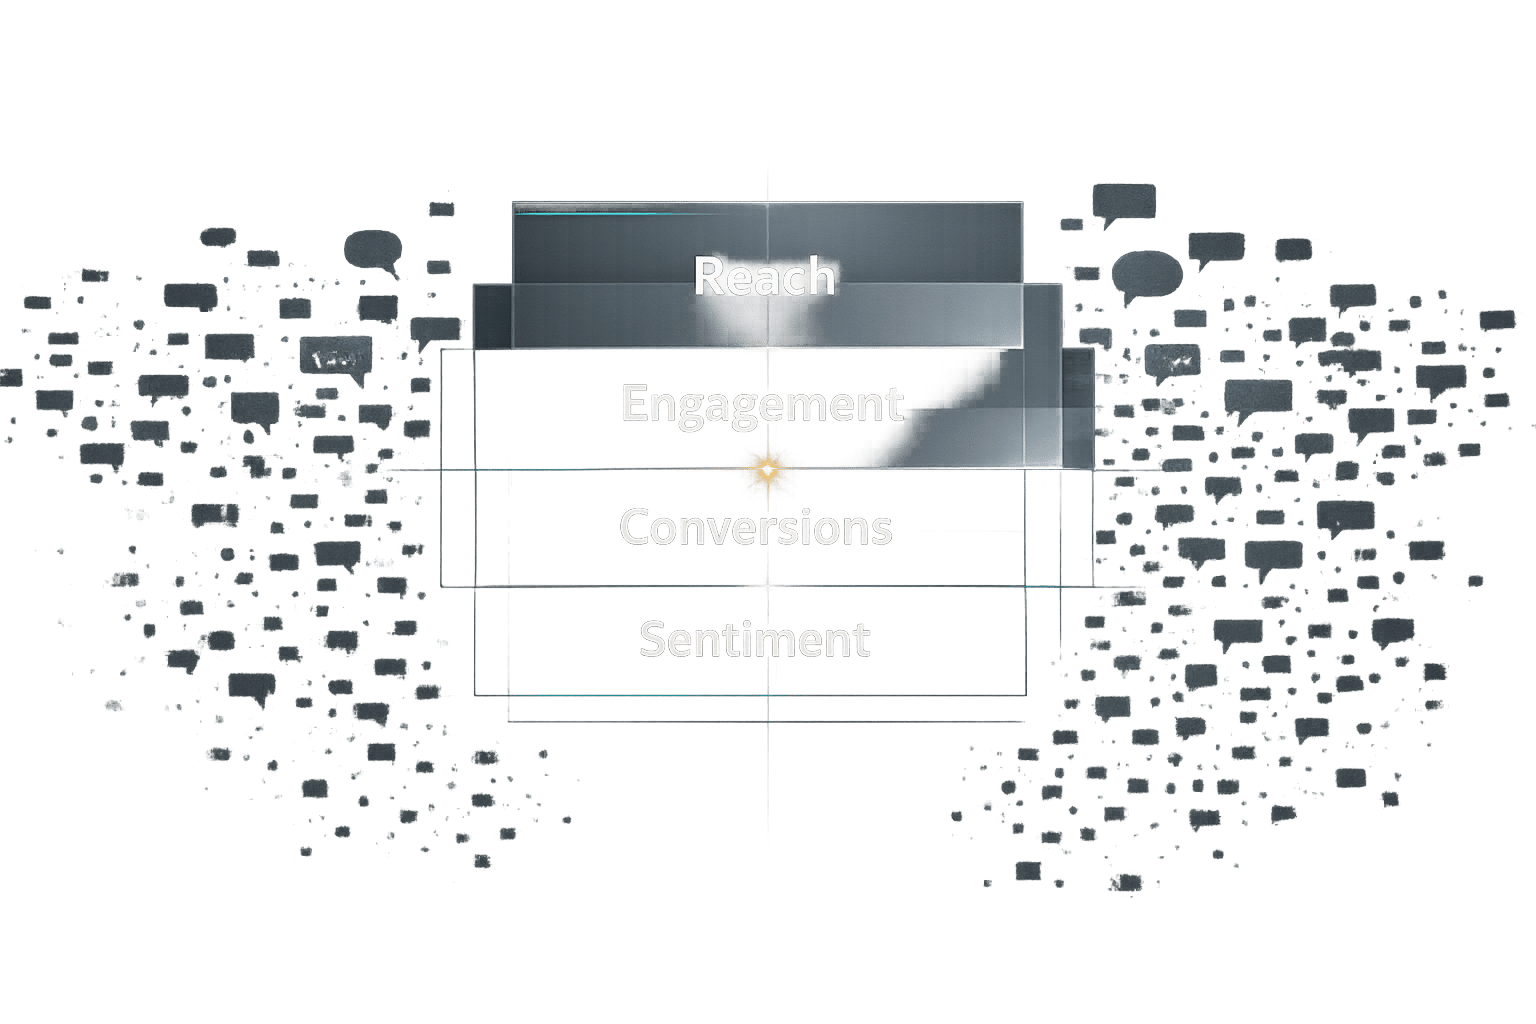
To get a clear picture of your storytelling performance, focus on four key areas: awareness (who's seeing your content), engagement (how they're interacting with it), conversion (what actions they're taking), and sentiment (how they feel about your brand). Each category reveals something unique, and together, they provide a comprehensive view of your success. Let’s dive into these metrics to see how they contribute to effective storytelling.
Awareness Metrics: Reach and Impressions
Reach measures how many unique people have seen your story, while impressions count the total number of times it was displayed - even if the same person sees it multiple times.
Ideally, your reach should hit around 2%–5% of your followers per post. Falling short of that range means your content isn't standing out. If you notice high impressions but low reach, it could indicate your story is circulating within a limited group instead of reaching new viewers. For instance, B2B companies often face a tough climb - 894 LinkedIn impressions are needed just to drive one website visit. And for businesses with high-ticket deals over $100,000, it takes 3.95 times more impressions to generate qualified leads compared to those with smaller deals.
Instead of obsessing over daily fluctuations, track these metrics month-over-month. A single viral post might feel exciting, but it's the overall trend that shows whether your storytelling is gaining traction with your audience.
Engagement Metrics: Audience Interaction
Engagement metrics reveal how much your audience cares about your story. Comments show active interest - someone took the time to respond. Shares extend your reach naturally, and saves indicate your content is valuable enough to revisit.
"As engagement becomes more scarce across platforms, comments are one of the clearest signals of active consumption. A comment shows more intent than a passive scroll or a quick view." - Mya Shell, Senior Social Media Manager, Quill
Engagement benchmarks differ by platform. LinkedIn typically sees 2% to 6%, Instagram 1% to 3%, and Facebook 0.08% to 1.5%. If your engagement rates are below these ranges, take a closer look at your top-performing posts. What sparked conversations or prompted shares? Use those insights to guide your future content.
Keep in mind that passive consumption - where users scroll without interacting - is becoming more common. This makes active engagement, like comments and shares, even more valuable. When someone comments, they're not just interested - they're invested enough to join the conversation.
Conversion Metrics: Stories to Business Results
Awareness and engagement are great, but they mean little if your stories don’t lead to business outcomes. Click-through rate (CTR) measures how many people clicked on your call-to-action, while conversion rate tracks how many completed an action, like signing up or purchasing.
Average CTRs vary by platform: Twitter leads with 1.64%, followed by Facebook at 0.9%, LinkedIn at 0.65%, and Instagram at 0.22%. If your CTR is low, your story might be engaging but not compelling enough to drive action.
To ensure your storytelling efforts translate to results, use UTM parameters in your links. This lets you track which posts drive traffic and conversions, so you’re not guessing about what’s working - you’ll know for sure.
Sentiment Metrics: Emotional Response
Sentiment analysis helps you understand the emotional impact of your storytelling by categorizing comments and mentions as positive, negative, or neutral.
81% of consumers say they need to trust a brand before making a purchase. Emotional stories can also boost the likelihood of repeat purchases by 3x. If your sentiment trends negative, it’s a red flag that your storytelling might be missing the mark - or worse, harming your brand image. Emotional resonance is key to building long-term loyalty and engagement.
While tools like Brandwatch or Sprout Social can automate sentiment tracking, don’t overlook the value of direct feedback. Surveys and customer interviews can uncover emotional nuances that algorithms might miss. Sometimes, a single detailed response can reveal exactly why a story clicked - or didn’t - with your audience.
Building a Measurement Framework
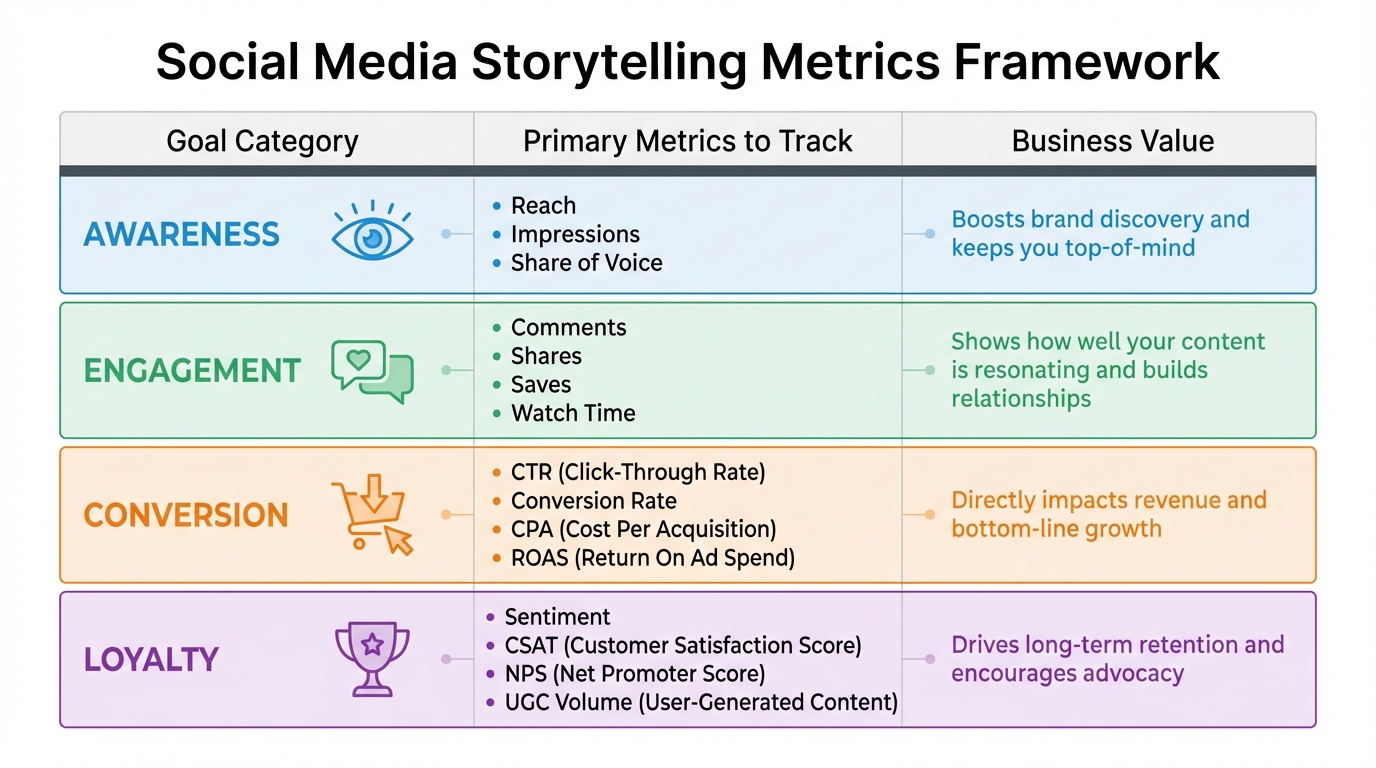
Social Media Storytelling Metrics Framework: Goals, KPIs and Business Value
Trying to track every possible metric is a recipe for burnout. Instead, create a straightforward framework that connects your storytelling efforts to actual business results.
Start by defining clear metrics and tying them directly to your business goals. For example, if you’re launching a new product, focus on conversions. If you’re rebranding to rebuild trust, prioritize sentiment and engagement. It’s not about tracking everything - it’s about tracking what matters. In fact, 94% of business leaders say social media insights play a key role in driving revenue and shaping decisions.
Once you know what to measure, establish a baseline. Use three to six months of historical data to set a starting point. If you’re new to this, industry benchmarks can help as temporary reference points. Just remember, benchmarks are averages - not goals. Past campaigns have shown that focused storytelling can lead to significant revenue growth, making it critical to understand where you began.
For tools, start simple. Free options like Meta Business Suite, LinkedIn Page Analytics, and YouTube Studio provide essential data on reach, engagement, and audience demographics. As your needs grow, third-party tools like Buffer or Semrush can help combine data from multiple platforms into a single dashboard. To track traffic more precisely, use UTM parameters on all your links.
Here’s a quick breakdown of common goals, metrics, and their business value:
| Goal Category | Primary Metrics to Track | Business Value |
|---|---|---|
| Awareness | Reach, Impressions, Share of Voice | Boosts brand discovery and keeps you top-of-mind |
| Engagement | Comments, Shares, Saves, Watch Time | Shows how well your content is resonating and builds relationships |
| Conversion | CTR, Conversion Rate, CPA, ROAS | Directly impacts revenue and bottom-line growth |
| Loyalty | Sentiment, CSAT, NPS, UGC Volume | Drives long-term retention and encourages advocacy |
Keep it simple. Pick a few key KPIs that align with your goals, set SMART targets, and stick to a consistent review schedule: monitor daily engagement, assess weekly content performance, and provide monthly reports. The goal is to track meaningful progress, not overwhelm yourself with data.
This framework gives you a strong foundation for analyzing engagement trends and fine-tuning your storytelling efforts.
Analyzing Storytelling Data
Find Patterns in Engagement Data
Once you've set up your measurement framework, it’s time to dig into the data and uncover actionable insights. This step is all about interpreting your metrics to understand what’s working and what isn’t. Start by identifying patterns in your top-performing posts. Look for recurring themes or elements that consistently drive engagement.
Pay close attention to Instagram Stories metrics like "Taps Back" - this happens when someone rewatches a frame, signaling strong interest in the content. On the other hand, metrics like "Exits" or "Swipe Aways" can pinpoint moments where viewers lose interest or disengage from the narrative.
If you're running paid campaigns, heatmaps can be a powerful tool. They show which parts of your content grab attention and where users tend to drop off. To get even more clarity, combine these findings with sentiment analysis. For example, origin stories that build trust and warmth may resonate differently than posts about product innovation, which might evoke curiosity - or even skepticism. With over 500 million daily views on Instagram Stories, understanding these nuances is key to refining your storytelling approach.
These insights not only highlight what grabs your audience’s attention but also help connect your storytelling efforts to measurable business outcomes.
Link Storytelling to Business KPIs
Engagement metrics become truly meaningful when they tie back to your business goals. Use UTM parameters on every story link to track conversions in tools like Google Analytics. This allows you to see which stories drive website visits, form completions, or even purchases.
Take it a step further with attribution modeling - whether it’s first-touch, last-touch, or multi-touch - to understand how each story contributes to the customer journey.
You can also calculate Social Media Customer Lifetime Value (CLV) by multiplying the number of new customers acquired through storytelling by your average customer lifetime value. Similarly, measure your Cost to Acquire a Customer (CAC) by dividing total story-related ad spend by the number of new customers gained. These metrics help quantify the direct impact of storytelling on revenue.
By aligning your narratives with measurable KPIs, you can ensure your storytelling efforts contribute directly to your business objectives.
Adjust Strategies Based on Data
The real power of data lies in how you use it. Once you’ve identified successful patterns, replicate what works while addressing areas that fall short. For example, if tutorial-style Reels generate 50% more saves than static images, focus on creating more of that type of content and schedule posts during peak engagement times.
For underperforming content, dig deeper. Is the issue a weak hook, the wrong platform, or a vague call-to-action? A great example comes from Red-D-Arc Welderentals. In 2020, they shifted their storytelling on Facebook and LinkedIn to tackle labor shortage concerns. By testing various landing pages based on real-time data, they successfully changed perceptions about robotic welding costs, leading to a significant boost in rentals.
Metrics like "Taps Back" can also guide your strategy. If viewers rewind to review details like pricing or product specs, consider creating dedicated posts or guides to address these interests. Use these insights to refine your content strategy and keep your storytelling aligned with what your audience values most.
Continuous Improvement Through Measurement
To keep your storytelling sharp and effective, it's essential to continuously refine your strategies using structured reporting and actionable insights.
Create Regular Reporting Cycles
Tracking the success of your social media storytelling isn’t a one-and-done task. It demands a consistent reporting routine that transforms raw data into meaningful takeaways. The timing of your reports should align with when decisions need to be made.
- Daily monitoring helps you stay on top of real-time engagement by tracking mentions, sentiment changes, and sudden spikes in activity.
- Weekly reviews give you a chance to fine-tune your content by identifying which formats perform best, monitoring audience growth, and comparing your progress to competitors.
- Monthly reports allow for a deeper dive, breaking down platform-specific performance, highlighting top-performing stories, and identifying emerging audience trends.
- Quarterly strategic reviews focus on long-term patterns, helping you adjust your storytelling direction based on broader insights.
A solid report should include an executive summary that highlights key wins and ROI, followed by metrics, platform-specific performance, campaign results, and strategic recommendations. Tools like Supermetrics can simplify this process by combining organic and paid metrics into a single dashboard.
"Measuring the success of ephemeral content is a different beast than a traditional Instagram post. Not only are you analyzing totally different metrics, but also trying to make sense of dozens of different data points in a 24-hour period." - Simon Pilkington, Digital Marketing Manager, Hello Social
To gain even deeper insight, supplement your data with surveys, interviews, and focus groups.
Refine Storytelling with Feedback
Use the trends and patterns identified in your data to adjust your storytelling strategically. For instance, if tutorial-style content consistently garners more saves than static posts, allocate more resources to that format and post it during peak engagement times. Experiment with A/B tests to figure out what works best - whether it’s tweaking captions, visuals, hashtags, or calls-to-action.
Pay close attention to how people interact with your stories. High "Exits" or "Swipe Away" rates can indicate where your content loses its audience, giving you clear areas to improve. Combine these metrics with qualitative insights, like sentiment analysis or survey feedback, to get a full picture of how your storytelling resonates.
Scale Measurement as You Grow
As your business grows, your approach to measurement should grow with it. Start with the basics using native analytics tools like Facebook Insights and Instagram Insights to track reach, impressions, and engagement. When you’re ready for more advanced analysis, transition to multi-platform dashboards like Hootsuite, Buffer, or Sprout Social to consolidate data from different channels.
Incorporate tools like UTM tracking with Google’s Campaign URL Builder to follow audience behavior after they click on your stories, ensuring accurate conversion tracking. Standardize your campaign naming and automate reports with tools that export data to Google Sheets or visualize it in Data Studio.
For businesses ready to take their analytics to the next level, advanced techniques like cohort analysis and multi-touch attribution modeling can provide deeper insights into audience behavior and ROI.
| Measurement Stage | Recommended Tools | Primary Focus |
|---|---|---|
| Early Growth | Native Analytics (Instagram/Facebook) | Reach, Impressions, Engagement Rate |
| Mid-Market | Buffer, Hootsuite, Google Analytics | Click-Through Rate (CTR), Conversion Rate, UTM Tracking |
| Advanced/Scaling | Sprout Social, Supermetrics, Brandwatch | ROI Attribution, Sentiment Analysis, Multi-touch Modeling |
Scaling your measurement efforts ensures your storytelling strategies evolve alongside your business. With 48% of marketers agreeing that Stories are becoming increasingly important for business growth and Instagram Stories receiving over 500 million daily views, refining your approach is key to staying competitive.
For small and mid-sized businesses looking for an all-in-one solution, platforms like BrandMultiplier.ai offer tools to unify storytelling with performance metrics. Explore their capabilities at BrandMultiplier.ai.
Conclusion
Evaluate your storytelling efforts to show how they contribute to real business results. By tracking the right metrics and tying them to goals like lead generation, customer retention, or revenue growth, social media shifts from being a "nice-to-have" to a strategic channel that justifies every dollar spent.
Start with a clear focus. Choose one primary goal - whether it’s brand awareness, conversions, or community building - and ensure all metrics align with that objective. Pay attention to consistent, long-term trends instead of chasing quick wins. As Gary Vaynerchuk puts it, "Most businesses are not playing the marathon. They're playing the sprint. They're not worried about lifetime value and retention. They're worried about short-term goals." Your measurement approach should support sustainable growth over time.
Once you establish a solid framework, let your data guide your decisions. For example, if specific storytelling approaches consistently drive higher engagement, double down on those strategies and phase out underperforming ones. Use tools like UTM parameters to track conversions, monitor sentiment, and benchmark performance against your goals. It’s worth noting that 88% of business leaders believe social media data plays a key role in improving customer retention.
Remember, consistency outshines fleeting viral moments. Storytelling is a long-term effort that demands patience and careful tracking.
As your business grows, refine your measurement strategy to match its scale. Start with basic metrics like engagement and reach, then expand to include conversion tracking and sentiment analysis. Use the insights you gather to create a feedback loop that improves your storytelling with each campaign. Platforms like BrandMultiplier.ai can help small and mid-sized businesses connect storytelling with measurable outcomes, making it easier to align creative efforts with performance metrics. By linking your narratives to tangible business results, storytelling becomes a powerful tool for driving sustained growth.
FAQs
Which 3 metrics should I track first for social storytelling?
When it comes to social storytelling, keeping an eye on the right metrics can help you understand how your content resonates with your audience. Here are the three key ones to focus on:
- Reach and Impressions: These metrics tell you how many people are seeing your content. They’re a great way to measure audience exposure and get a sense of your brand’s visibility.
- Engagement Rate: This tracks interactions like likes, comments, and shares. It’s a clear indicator of how well your audience is connecting with your content.
- Completion Rate: Specifically for stories, this shows how many viewers stick around to watch from beginning to end. It’s a useful way to evaluate how effective your storytelling really is.
By monitoring these, you’ll gain valuable insights into what’s working and where there’s room for improvement.
How do I connect a story post to sales in Google Analytics?
To link a story post to sales through Google Analytics, start by setting up conversion tracking. Then, tag your story links with UTM parameters to track their performance. In Google Analytics, head to the Acquisition reports to monitor traffic and conversions. Use this data to identify which stories are driving sales and adjust your storytelling approach to focus on what works best.
What should I do if engagement is low but reach is high?
If your content has high reach but low engagement, it’s time to evaluate how well your messaging connects with your audience. While a wide reach indicates that people are seeing your content, low engagement points to a potential issue with how it's resonating. This could mean your storytelling needs a refresh.
Take a closer look at metrics like likes, comments, and shares to understand what drives interaction. Are certain topics or formats performing better than others? Use these insights to tweak your approach and make your content more relevant and engaging. The goal is to not just be seen, but to spark meaningful interactions.
Ready to transform your brand story?
Schedule a free diagnostic to see how we can help.
Schedule The Diagnostic