
10 Metrics for Omnichannel Segmentation Success
10 Metrics for Omnichannel Segmentation Success
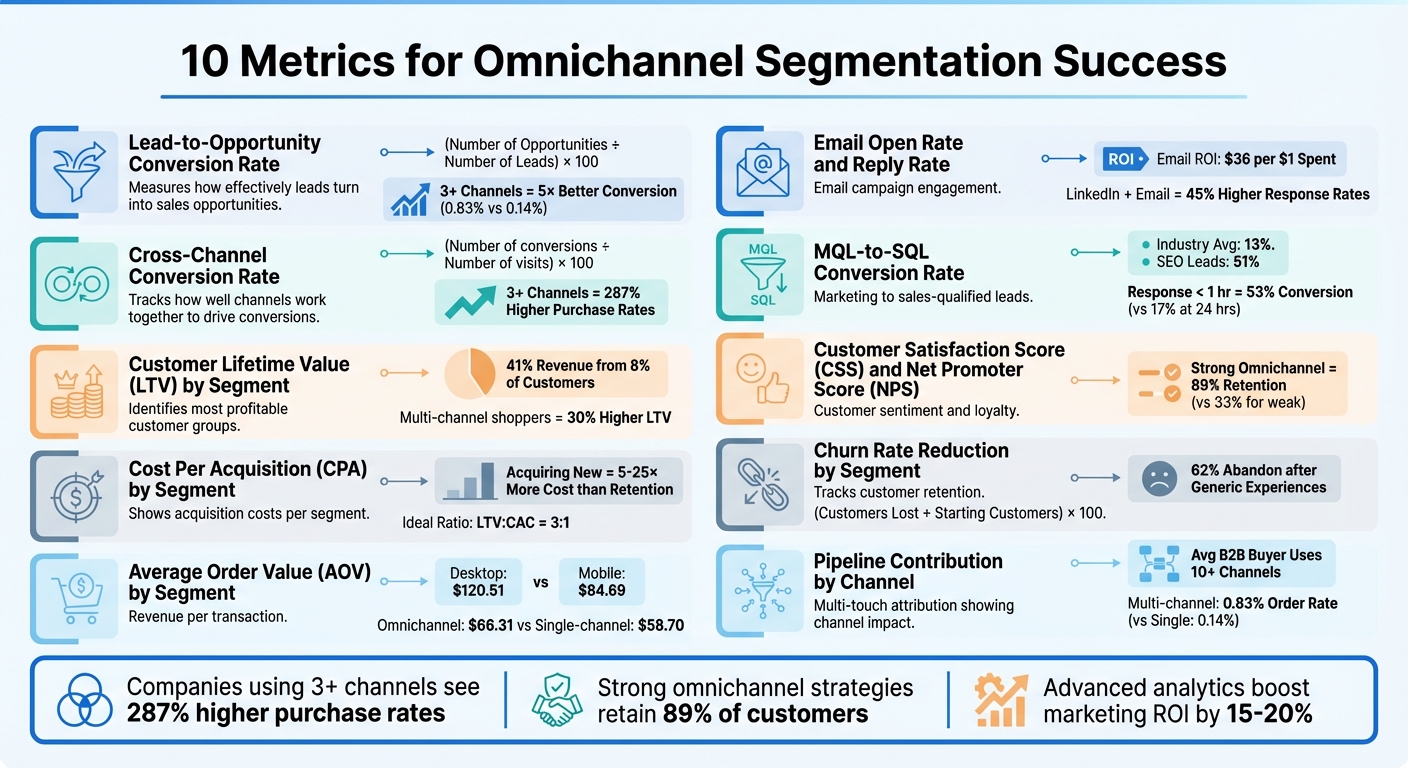
Tracking the right metrics is essential for maximizing the effectiveness of your omnichannel marketing strategy. This article outlines 10 key metrics that help businesses measure performance, reduce costs, and increase customer retention. Here’s a quick summary:
Key Metrics:
- Lead-to-Opportunity Conversion Rate: Measures how effectively leads are turning into sales opportunities across channels.
- Cross-Channel Conversion Rate: Tracks how well different channels work together to drive conversions.
- Customer Lifetime Value (LTV) by Segment: Identifies the most profitable customer groups.
- Cost Per Acquisition (CPA) by Segment: Shows how much it costs to acquire customers in specific segments.
- Average Order Value (AOV) by Segment: Highlights revenue per transaction to optimize upselling and cross-selling.
- Email Open Rate and Reply Rate: Evaluates email campaign engagement and lead quality.
- MQL-to-SQL Conversion Rate: Assesses how well marketing-qualified leads transition to sales-qualified leads.
- Customer Satisfaction Score (CSS) and Net Promoter Score (NPS): Measures customer sentiment and loyalty by segment.
- Churn Rate Reduction by Segment: Tracks customer retention and identifies at-risk groups.
- Pipeline Contribution by Channel: Uses multi-touch attribution to determine how channels contribute to revenue.
Why These Metrics Matter:
- Companies using three or more channels see 287% higher purchase rates than single-channel campaigns.
- Strong omnichannel strategies retain 89% of customers, compared to 33% for weaker strategies.
- Advanced analytics can boost marketing ROI by 15–20%.
Takeaway: Monitoring these metrics enables businesses to make data-driven decisions, optimize marketing spend, and create scalable growth. Each metric ties directly to key performance indicators like Customer Acquisition Cost (CAC), Lifetime Value (LTV), and conversion rates.
Let’s dive into how each metric impacts your business and how to track them effectively.
10 Key Metrics for Omnichannel Segmentation Success
1. Lead-to-Opportunity Conversion Rate
Why this metric matters for omnichannel segmentation
This metric measures how many of your leads turn into qualified sales opportunities. It's often seen as a "North Star" KPI for B2B sales teams because it reveals whether your omnichannel segmentation is reaching the right audience. A strong conversion rate indicates that you're targeting prospects who are ready to buy.
The real insight comes from understanding which channel combinations drive leads forward. With 80% of B2B sales interactions now happening in digital channels, knowing which touchpoints matter most is critical. For example, leads engaging with three or more channels often convert up to 5× better (0.83% order rate) than those who interact with just one channel (0.14%). This highlights the power of omnichannel campaigns in driving meaningful engagement.
How to measure it with available tools
The formula is simple: (Number of Opportunities ÷ Number of Leads) × 100. However, accurate tracking requires a unified data approach. Tools like a CRM integrated with marketing automation or a CDP such as Twilio Segment can help consolidate data. Without this, you risk inaccuracies, as the average mid-market company uses 185 different apps, leading to data silos.
To ensure precision, use identity resolution to track individual interactions across email, LinkedIn, webinars, and your website. Standardizing naming conventions is also crucial - variations like "user_signup" versus "user_sign_up" can corrupt your data. Additionally, move beyond "last-click" attribution models to multi-touch attribution. This approach reveals which combination of channels drives the transition from lead to opportunity.
Effect on business KPIs (CAC, LTV, conversion rates)
Improving your Lead-to-Opportunity conversion rate has a direct impact on key metrics. It lowers CAC by reducing wasted spending on unqualified leads. At the same time, it enhances LTV because leads nurtured through multiple channels tend to become loyal customers. Data shows that companies with strong omnichannel engagement retain 89% of their customers, compared to just 33% for those with weaker engagement.
"Data proves omnichannel pays off: More than three-quarters of B2B marketers who adopted omnichannel saw increased lead generation last year, compared to fewer than half of those using fewer channels." - Rachana Pallikaraki, Martal Group
Regularly monitoring and adjusting your strategy ensures you're not wasting budget on leads that won't convert. Companies leveraging advanced analytics to track omnichannel performance report 15–20% higher ROI from their marketing investments.
Next, let’s explore another critical metric to assess the effectiveness of your omnichannel segmentation.
sbb-itb-63525a7
2. Cross-Channel Conversion Rate
Why This Metric Matters for Omnichannel Segmentation
The cross-channel conversion rate tracks the percentage of users who complete a high-value action after interacting with your brand across multiple touchpoints. Unlike single-channel metrics, this KPI gives insight into how well your channels work together to guide specific audience segments toward a purchase, rather than operating independently.
Here’s a key stat: campaigns that use three or more channels see purchase rates jump by 287% compared to single-channel efforts. This metric not only helps you identify the best-performing segment and channel combinations but also pinpoints areas of friction. For example, if your cross-channel conversion rate is low, it could signal that repetitive or excessive messaging is turning users away. Understanding this metric allows you to fine-tune your approach for better results.
How to Measure It with Available Tools
To measure cross-channel conversion rates effectively, you need a unified view of your data. The average mid-market company relies on 185 different apps, which often creates data silos that make it tough to track customer behavior across channels. A Customer Data Platform (CDP) like Twilio Segment or a centralized CRM like HubSpot can help consolidate data from sources like email, SMS, social media, apps, and even offline interactions.
The formula is straightforward: (Number of conversions ÷ Number of visits) × 100. However, for a more nuanced understanding, use weighted multi-touch attribution models. These models distribute credit across all touchpoints that contribute to a conversion, rather than focusing solely on the final interaction. This approach helps you identify which channel combinations are most effective for each segment.
Effect on Business KPIs (CAC, LTV, Conversion Rates)
Boosting your cross-channel conversion rate can significantly improve core business metrics. Companies that use advanced analytics to track omnichannel performance enjoy a 15–20% higher ROI on their marketing efforts. Additionally, a well-executed omnichannel strategy can increase Customer Lifetime Value (LTV) by 30% or more. Customers who engage across multiple channels tend to spend more and exhibit stronger brand loyalty over time.
Retention also benefits immensely. Businesses with strong omnichannel engagement see a 91% increase in year-over-year customer retention rates and can retain up to 89% of their customers, compared to just 33% for those with weaker strategies. Seamless, personalized cross-channel experiences build trust - nearly half (49%) of consumers say they would make repeat purchases after such interactions. By analyzing which channel combinations drive the most conversions for each segment, you can cut wasted spending on underperforming paths and focus resources on strategies that deliver results. Aligning these insights with your segmentation strategy ensures every channel contributes meaningfully to your business growth.
3. Customer Lifetime Value (LTV) by Segment
Why This Metric Matters for Omnichannel Segmentation
After analyzing cross-channel conversion trends, the next step is to evaluate how revenue holds up across different customer groups using Customer Lifetime Value (LTV).
LTV by segment highlights which customer groups generate the most revenue. For instance, 41% of an e-commerce store's revenue often comes from just 8% of its customers. This stark imbalance makes it clear: treating all customers the same can lead to wasted resources on lower-value groups while neglecting the most profitable ones.
Segmenting LTV offers a clearer picture of future revenue potential. This is particularly crucial in omnichannel marketing, where customers shopping across multiple channels tend to have a 30% higher lifetime value compared to single-channel shoppers. By understanding LTV at a segment level, businesses can justify the investment in omnichannel strategies and allocate resources more effectively.
"CLTV is your North Star. CLTV tells you how much value a customer brings over time, not just per transaction."
– Kenscio
How to Measure It with Available Tools
To measure LTV accurately, start by unifying customer data through tools like Twilio Segment or Lexer. These Customer Data Platforms (CDPs) resolve identities across channels, eliminating data silos that can distort LTV calculations.
You can calculate LTV using historical data (total spend-to-date) or predictive models that account for trends like seasonality. For a deeper dive, use RFM analysis - which categorizes customers based on Recency (days since last purchase), Frequency (number of orders), and Monetary value (total spend). This method helps identify key groups like "Champions", "Loyalists", and "At-risk" customers. Tools like ProfitWell, Growlytics, and Kuma can automate these calculations and provide visual dashboards for easier interpretation.
Effect on Business KPIs (CAC, LTV, Conversion Rates)
A healthy CLV to CAC ratio - ideally 3:1 - ensures that every dollar spent on acquiring customers returns at least three dollars in lifetime value. Segmenting customers by LTV allows businesses to set clear acquisition and retention cost limits based on the future value of each group.
This segmentation also refines resource allocation. For example, identifying the products that high-LTV customers purchase first can guide acquisition campaigns to attract similar high-value customers. Additionally, LTV segmentation helps identify high-value customers who may be at risk of churning, enabling timely retention efforts. With leading omnichannel brands achieving retention rates as high as 89%, focusing on retaining high-LTV segments can protect core revenue streams while reducing overall churn.
Next, we’ll explore how acquisition cost metrics can further sharpen your segmentation strategy.
4. Cost Per Acquisition (CPA) by Segment
Why This Metric Matters for Omnichannel Segmentation
Customer Lifetime Value (LTV) sheds light on which groups bring in the most revenue over time, but Cost Per Acquisition (CPA) by segment reveals how much you're spending to secure those customers in the first place. Without breaking this down by segment, you might find yourself spending more on acquisition than the value those customers bring.
By analyzing CPA by segment, you can compare how cost-effective different channels and customer groups are. For instance, acquiring customers through direct mail may cost more than social media, but those direct mail customers might convert at much higher rates. This insight helps you balance cost and effectiveness.
Here’s a reality check: acquiring a new customer costs anywhere from 5 to 25 times more than retaining an existing one. When you layer in segmentation, you can pinpoint which groups justify higher acquisition costs and which ones are draining resources. Tracking CPA by segment ensures you’re making informed decisions about which channel combinations deliver the best results.
How to Measure It with Available Tools
Calculating CPA for a specific segment is straightforward: divide the total cost of a segment-specific campaign by the number of conversions within that segment. The challenge? Customer journeys in omnichannel marketing are rarely linear. A customer might discover your brand on Instagram, research you on your website, and complete the purchase via email.
"CPA measures the cost incurred to acquire a customer through a marketing campaign. To calculate the CPA, divide the total cost of the campaign by the total number of conversions." – Ankita Kaushik, Content Marketer, MoEngage
Tools like Customer Data Platforms (CDPs), such as Twilio Segment, simplify this process. These platforms unify data from websites, apps, and even offline stores into a single view. This prevents double-counting acquisition costs and ensures every touchpoint in the customer journey is accounted for. Multi-touch attribution models further refine this by distributing credit across all interactions rather than just the last click.
One critical step is validating contact data before outreach. For example, a study of 40 million phone numbers found that 13.7% didn’t support SMS. If you don’t account for unreachable leads, you risk underestimating your actual acquisition costs.
Effect on Business KPIs (CAC, LTV, Conversion Rates)
Tracking CPA by segment has a direct impact on key business metrics. CPA acts as a leading indicator for Customer Acquisition Cost (CAC). If a segment’s CPA is high, the CAC for that segment will likely follow suit - unless the lead-to-customer conversion rate is extraordinarily high.
A high CPA for a segment could indicate inefficiencies in your funnel. However, if that segment also has a strong LTV, the higher cost might be worth it. A common benchmark here is a 3:1 ratio of LTV to CAC. Companies that use advanced analytics to track omnichannel performance often see a 15–20% boost in ROI on their marketing efforts.
CPA also has an inverse relationship with conversion rates. By monitoring CPA across segments, you can quickly shift resources from underperforming groups to those delivering better results.
"By communicating on each of your customers' preferred channels, you will be reducing spend on underperforming channels and increase your conversion rates across the board." – Twilio Segment
Next, we’ll dive into how Average Order Value by segment can uncover opportunities to fine-tune your pricing strategies for your most profitable customer groups.
5. Average Order Value (AOV) by Segment
Why This Metric Matters for Omnichannel Segmentation
AOV by segment tells you how much revenue you’re earning per transaction, giving insights into how to maximize profits from your current customers. Boosting AOV is often more cost-effective than trying to bring in new traffic - it’s about getting more value from customers you’ve already acquired, without adding acquisition expenses.
Breaking down AOV by factors like channel, device, or customer type helps identify where the highest-value transactions are happening. For instance, desktop users tend to have a 15%–25% higher AOV, averaging $120.51 compared to $84.69 for mobile users. This kind of data can guide merchandising strategies, such as offering bundles or premium products.
Customers who shop across multiple channels spend even more - 4% extra per visit to a physical store and 10% more online compared to single-channel shoppers. On average, omnichannel marketing generates an AOV of $66.31 per order, compared to $58.70 for single-channel marketing. Tracking AOV by segment helps pinpoint which groups are most responsive to cross-selling and upselling opportunities.
Like with CPA, breaking down AOV into detailed segments allows for precise optimization, helping you make smarter, data-driven decisions across all channels.
How to Measure It with Available Tools
Measuring AOV by segment is relatively simple: divide the total revenue from a specific segment by the number of orders placed within that segment. To get accurate results, combine data from all channels using tools like Customer Data Platforms (CDPs), which ensure identity resolution across platforms. Platforms like Klaviyo can even use predictive analytics to segment customers based on AOV thresholds automatically. If you have direct access to your database, SQL queries can also help link customer and order data by segment.
Here’s a useful tip: set your free shipping threshold about 30% higher than your current AOV to encourage customers to spend more. Just be cautious - setting the threshold too high might hurt your conversion rates, even if it increases AOV.
By consolidating data from all sources, you can get a complete picture that directly influences your key business outcomes.
Effect on Business KPIs (CAC, LTV, Conversion Rates)
AOV has a direct impact on Customer Lifetime Value (LTV), as LTV is calculated by multiplying AOV by purchase frequency and customer lifespan. By increasing AOV, you’re effectively increasing the value of each customer, which can justify a higher Customer Acquisition Cost (CAC) due to better returns on investment. A higher AOV also boosts Revenue Per Visitor (RPV), which is calculated by multiplying conversion rate by AOV. Even if your conversion rates stay the same, a higher AOV means more revenue from every site visitor. Businesses that track omnichannel performance with advanced analytics often see a 15%–20% increase in ROI from their marketing spend.
"A 10% AOV lift has the same revenue impact as acquiring 10% more customers, but typically costs much less to achieve through optimization rather than acquisition." – Cuped.ai
If a particular segment has a low AOV, it could indicate that customers view your brand as more of a discount option rather than a place for higher-value purchases. Monitoring AOV by segment helps you adjust your branding and merchandising strategies to encourage larger purchases and improve customer perception.
6. Email Open Rate and Reply Rate
Why This Metric Matters for Omnichannel Segmentation
Open rates are a key indicator of whether your subject lines, sender names, and timing resonate with your audience. After all, if an email isn’t opened, nothing else can happen. High open rates suggest your personalization efforts are on point and that you’re reaching the right people at the right time.
Reply rates, especially in B2B contexts, go beyond surface-level engagement to show genuine interest. For example, pairing email campaigns with LinkedIn outreach can increase response rates by 45% and lead to 3.5× more meeting bookings. This highlights the strength of combining multiple channels to engage prospects where they’re most active.
A sudden drop in open rates can act as an early warning, signaling issues like segment fatigue, irrelevant content, or deliverability problems such as landing in spam folders. However, since Apple’s Mail Privacy Protection has inflated open rates by 15–30% since 2021, interpreting this metric has become more complex.
How to Measure It with Available Tools
To calculate open rates, divide unique opens by delivered emails and multiply by 100. But be cautious - Apple Mail now pre-loads email content, which can artificially boost open rates. For a clearer picture, track the Click-to-Open Rate (CTOR), which measures the percentage of people who clicked a link after opening the email. CTOR is calculated by dividing unique clicks by unique opens.
For reply rates, particularly in B2B, tools that integrate email with LinkedIn outreach can provide a unified view of response metrics. Customer Data Platforms (CDPs) like Twilio Segment help consolidate email data with other touchpoints, eliminating data silos and offering a fuller view of engagement. Consistent UTM parameters (e.g., utm_source=email, utm_medium=newsletter) also allow you to track post-click behavior in Google Analytics 4.
Some strategies have shown remarkable success. For instance, BlaBlaCar found that using a real first name as the sender instead of a brand name increased open rates by over 20% in A/B tests conducted in France and Russia. Similarly, PureGym achieved a 55% open rate - well above industry benchmarks - by sending location-specific, segmented emails.
These insights directly impact the effectiveness of your marketing campaigns.
Effect on Business KPIs (CAC, LTV, Conversion Rates)
Email marketing is one of the most cost-effective channels, delivering an average ROI of $36 for every $1 spent. Open rates are critical because they act as the entry point for conversions. Meanwhile, reply rates provide a clear measure of lead quality, helping sales teams convert Marketing Qualified Leads (MQLs) into Sales Qualified Leads (SQLs).
Tracking segmented engagement helps identify active and inactive subscribers. This allows for targeted re-engagement efforts, which protect customer lifetime value (LTV). For example, Huega House, a lifestyle brand, combined segmented email campaigns with Meta, TikTok, and Google ads, achieving 2,190% growth in Shopify revenue and a 9.87× Marketing Efficiency Ratio.
Using three or more channels in tandem can lead to a 287% higher purchase rate compared to relying on a single channel. By integrating email engagement data with other touchpoints, marketers can better understand customer journeys, identify gaps, and fine-tune their strategies for maximum impact.
7. MQL-to-SQL Conversion Rate
Why This Metric Matters for Omnichannel Segmentation
The MQL-to-SQL conversion rate reveals whether your segmentation strategies are attracting buyers who are ready to engage. Revenue often takes a hit when channels don’t sync properly, handoffs between teams are unclear, or messaging misses the mark.
"Conversion tracking reveals where go-to-market coordination breaks down." - Ali Yildirim, Author, Understory
On average, the MQL-to-SQL conversion rate across industries is 13%. But the source of leads plays a huge role here. For example, SEO-generated MQLs convert to SQLs at a high 51%, while PPC and event-generated leads convert at 26% and 24%, respectively. Companies that use behavioral scoring models - tracking actions like clicks, page views, and downloads - see conversion rates of 39–40%, almost three times higher than those relying on disjointed systems.
Timing is also a game-changer. Companies that respond to a qualified lead within one hour achieve a 53% conversion rate, compared to just 17% for those that wait 24 hours. This highlights how vital real-time coordination is within an omnichannel setup.
How to Measure It with Available Tools
To calculate the MQL-to-SQL conversion rate, divide the number of SQLs by the number of MQLs, then multiply by 100. However, accuracy depends on marketing and sales teams agreeing on a shared definition of what makes a lead "qualified", using behaviors, demographics, and intent signals as criteria.
Go beyond basic demographic scoring by incorporating behavioral signals - such as a prospect visiting a pricing page after attending a webinar. Use CRM tools like Salesforce or HubSpot alongside marketing automation platforms to unify data from multiple touchpoints like email, social media, and web. Real-time notifications, such as Slack alerts, can help sales teams follow up with SQLs during the critical "golden hour".
Set up feedback loops between sales and marketing. For instance, sales teams can flag leads that weren’t ready to convert, helping marketing refine segmentation and scoring models. This ongoing adjustment ensures your omnichannel strategy stays aligned with buyer behavior, which ultimately improves metrics like CAC and LTV.
Effect on Business KPIs (CAC, LTV, Conversion Rates)
A better MQL-to-SQL conversion rate aligns sales and marketing efforts, making your omnichannel strategy more efficient. This alignment directly lowers Customer Acquisition Cost (CAC) by reducing the time and resources spent on unqualified leads. It also boosts Customer Lifetime Value (LTV) by focusing sales efforts on high-quality, high-intent prospects. Companies with strong sales and marketing alignment are 67% more likely to convert MQLs to SQLs.
Take GlowSkin, a skincare brand, as an example. In July 2025, they adopted journey-based tracking to grow revenue without increasing CAC. By identifying that most purchases started on Instagram but closed via email or their app, they revamped their automation workflows. This led to a 28% increase in cross-channel conversions and a 14% reduction in CAC.
Organizations with strong omnichannel engagement retain 89% of their customers, compared to just 33% for those with weaker engagement. Tracking MQL-to-SQL conversion rates can help pinpoint bottlenecks in your funnel and refine the channels that deliver the most qualified leads.
8. Customer Satisfaction Score (CSS) and Net Promoter Score (NPS) by Segment
Why This Metric Matters for Omnichannel Segmentation
Customer sentiment metrics like Customer Satisfaction Score (CSS) and Net Promoter Score (NPS) provide a deeper understanding of how customers feel about their experiences across different channels. These metrics go beyond conversion and cost data, offering insights into loyalty and the likelihood of customers recommending your brand to others.
NPS divides customers into three groups: Promoters (scores 9–10), Passives (scores 7–8), and Detractors (scores 0–6). This breakdown helps you see which segments are advocating for your brand and which might be harming your reputation. Comparing NPS across channels can reveal where the customer experience might be faltering. For instance, if your online shoppers rate you highly but your in-store customers don't, it highlights a specific area needing improvement.
"Differences in NPS scores by channel - for example, if your most dissatisfied customers almost always shop in-store - will point you to discontinuity in your omnichannel experience and reveal areas for improvement." - Lexer
Strong omnichannel brands retain up to 89% of their customers, compared to just 33% for those with weaker strategies. Metrics like CSS and NPS help uncover problem areas - like a confusing checkout process or subpar customer service - before they lead to lost loyalty.
How to Measure It with Available Tools
CSS is often measured through quick surveys sent immediately after key interactions, such as completing a purchase or resolving a support issue. Customers are typically asked to rate their experience on a scale of 1 to 5. NPS, on the other hand, is calculated by asking: "How likely are you to recommend us to a friend?" Responses are scored from 0 to 10, and the NPS is determined by subtracting the percentage of Detractors from the percentage of Promoters.
| Metric | Purpose | Calculation Method |
|---|---|---|
| Net Promoter Score (NPS) | Measures long-term loyalty and advocacy | % Promoters (9–10) minus % Detractors (0–6) |
| Customer Satisfaction (CSS) | Measures satisfaction with specific touchpoints | (Satisfied Respondents / Total Respondents) × 100 |
A Customer Data Platform (CDP) can integrate survey responses with customer profiles, helping you link satisfaction levels to purchasing behavior and channel preferences. Including open-ended questions like "What would make this a 10?" can provide valuable qualitative insights. Segmenting the results by channel allows you to identify and address experience gaps.
For example, Benefit Cosmetics launched its "Mirror Mirror" program in 2022 across 32 stores to track NPS and gather post-purchase feedback. Store managers acted on customer concerns in real time, leading to a 5.8-point increase in NPS over nine months.
These insights are essential for refining segmentation strategies, which directly affect customer acquisition costs (CAC) and lifetime value (LTV).
Effect on Business KPIs (CAC, LTV, Conversion Rates)
While conversion and cost metrics guide operational tweaks, CSS and NPS shape broader strategies to improve LTV and cross-channel performance. High NPS scores fuel organic growth through referrals, reducing CAC. Considering that acquiring new customers is 5–25 times more expensive than retaining them, and that existing customers are 40% more likely to make repeat purchases, these metrics are critical. Promoters often have higher LTV because they buy more often and stay loyal longer.
Combining satisfaction scores with data like ticket volumes can also refine your acquisition strategy. For instance, if low-value customers frequently complain and score poorly, you might exclude them from future campaigns to optimize spending and lower CAC. In many businesses, the top 20% to 40% of customers drive 60% to 80% of revenue. Focusing on high-LTV Promoters ensures better returns through repeat purchases and referrals.
"High customer satisfaction score correlates with revenue growth." - DashThis
9. Churn Rate Reduction by Segment
Why This Metric Matters for Omnichannel Segmentation
Churn rate tells you how many customers stop buying from your business. Breaking this down by segment - like acquisition source, device type, or customer value tiers - gives you insight into which groups are leaving and why. This is crucial because keeping existing customers is far cheaper than attracting new ones. By focusing on specific segments, you can target your retention efforts where they'll make the biggest impact.
Here's a striking fact: 62% of consumers will abandon a brand entirely after a generic experience, while 49% are likely to return after a personalized one. Omnichannel segmentation ensures your interactions feel tailored at every touchpoint, building loyalty instead of frustration. Without unified data, you might accidentally send a win-back email to someone who just shopped in-store, creating confusion rather than connection.
High-value customers often contribute the most to your revenue. If you notice churn is disproportionately affecting this group, it could severely hurt your bottom line. Segmentation allows you to pinpoint these issues and focus on retaining your most valuable customers.
How to Measure It with Available Tools
The formula for churn rate is simple: Churn Rate = (Customers Lost ÷ Starting Customers) × 100. To get meaningful insights, segment this data by factors like acquisition channel, purchase frequency, or customer value. A Customer Data Platform (CDP) can unify data from in-store, web, and mobile interactions, giving you a clear picture of customer behavior and helping you spot churn risks early.
Look for early warning signs like declining engagement, more frequent customer service complaints, or longer gaps between purchases. For example, if a segment usually buys every 28 days, and you see delays, consider sending a reminder around day 20. A drop in app usage or feature interaction can also signal disengagement. Similarly, a surge in customer service tickets from a specific segment might highlight friction.
Net Promoter Score (NPS) surveys are another tool to flag potential churn. Customers scoring between 0–6 ("Detractors") are at risk of leaving. Subtract the percentage of detractors from promoters to calculate your NPS, which often correlates directly with revenue growth. Platforms like Twilio Segment or Lexer can help resolve customer identities across channels, while DashThis simplifies omnichannel reporting.
Effect on Business KPIs (CAC, LTV, Conversion Rates)
Reducing churn has a direct impact on key metrics, particularly Customer Lifetime Value (LTV). An omnichannel strategy can boost LTV by 30% or more. Businesses with strong omnichannel approaches retain up to 89% of their customers, and retention rates soar by 90% compared to single-channel strategies.
Lower churn also means lower Customer Acquisition Costs (CAC). Retaining customers costs far less than acquiring new ones, and companies that use advanced analytics to measure omnichannel performance see a 15% to 20% higher ROI on their marketing efforts.
Conversion rates benefit as well. Campaigns using three or more channels achieve a 287% higher purchase rate than single-channel efforts. Lower churn reflects happier, more loyal customers, which leads to more frequent purchases and stronger word-of-mouth referrals. The link between churn reduction and improved KPIs highlights the value of using advanced tools to monitor and act on these trends in real time.
10. Pipeline Contribution by Channel (Multi-Touch Attribution)
Why This Metric Matters for Omnichannel Segmentation
Pipeline contribution is a key metric for understanding how different touchpoints drive revenue, not just traffic. With the average B2B buyer interacting across more than 10 channels during their journey, relying on last-click attribution oversimplifies the process. Instead, multi-touch attribution helps reveal how channels like email, LinkedIn, and webinars work together to guide prospects from awareness to decision-making.
This metric also bridges the gap between sales and marketing by providing shared KPIs. Instead of debating over credit, both teams can see how their efforts contribute to the pipeline. It also uncovers "halo effects", where awareness-focused channels like social media indirectly drive demand captured by branded search or direct traffic. Without tracking these interactions, you might cut a channel that’s quietly boosting conversions.
The data is clear: multi-channel campaigns outperform single-channel efforts significantly, with a 0.83% order rate compared to just 0.14% - almost five times higher. Knowing which channel combinations resonate with specific segments allows for more effective, integrated outreach instead of disjointed campaigns.
How to Measure It with Available Tools
To measure pipeline contribution effectively, start by implementing a Customer Data Platform (CDP) to unify data from email, CRM, social media, and offline interactions. Without this integration, data silos can distort attribution accuracy. Consistent naming conventions across platforms are also critical - standardized labels like "user_signed_up" help prevent confusion.
Selecting the right attribution model is equally important. For instance, a W-shaped model works well for B2B sales cycles with clear milestones, assigning about 30% credit to the first touch, lead creation, and final conversion. For shorter sales cycles, time-decay models that emphasize touchpoints closer to conversion may be more suitable. Additionally, tracking your "average channels per win" can provide insights into how many touchpoints lead to successful deals versus those that don’t.
To validate your findings, use incrementality testing. Geo-based tests or holdout groups can help confirm whether channels in the conversion path are actively driving results or merely correlating with them. These approaches ensure your data feeds directly into optimizing business strategies.
Effect on Business KPIs (CAC, LTV, Conversion Rates)
Refined pipeline attribution has a direct impact on critical KPIs. For example, it can lower Customer Acquisition Cost (CAC) by reallocating spend from channels that only capture existing demand to those that create new opportunities. Companies leveraging advanced analytics for omnichannel performance often achieve 15–20% higher ROI on marketing investments.
Better attribution also enhances Customer Lifetime Value (LTV). By identifying which channel combinations attract high-value customers, businesses can replicate those strategies across segments, potentially boosting LTV by 30% or more. Organizations with strong omnichannel strategies retain an impressive 89% of their customers, compared to just 33% for those with weaker approaches.
Finally, optimized attribution improves conversion rates by highlighting the most effective touchpoints in the sales funnel. This accelerates the sales cycle, enabling businesses to close more deals without increasing budgets. By focusing on the channels that truly move prospects toward a decision, you can achieve more efficient and impactful outcomes.
Optimizing omnichannel marketing efforts with a data and analytics-powered measurement framework
Tools and Methods for Tracking These Metrics
Tracking segmentation metrics effectively is key to refining omnichannel strategies. One powerful option is using Customer Data Platforms (CDPs), which consolidate first-party data from sources like websites, apps, email, and physical stores into unified, real-time customer profiles. For example, Camping World leveraged Twilio Segment's CDP to combine behavioral data from RV browsing and in-store interactions. This approach led to a 35% boost in conversion rates on paid channels and slashed data engineering costs by over $3 million.
Marketing automation platforms, such as Klaviyo, offer built-in omnichannel analytics to monitor engagement and revenue across channels like email, SMS, and WhatsApp. These platforms go beyond last-click attribution, enabling multi-touch attribution models that credit every interaction contributing to a purchase. Meanwhile, Business Intelligence tools like SegMetrics bring together data from ad platforms, CRMs, and payment processors to provide a "single source of truth." This allows businesses to track longer-term metrics like LTV (lifetime value) and ROAS (return on ad spend).
However, integrating these tools smoothly is just as important as selecting them. To avoid data inconsistencies, teams should standardize naming conventions. Implementing server-side tracking can help bypass ad blockers and maintain accuracy across devices. Additionally, identity resolution is crucial for stitching together customer journeys across multiple sessions.
For smaller businesses or startups without dedicated data teams, AI-powered tools can simplify the process. For instance, BrandMultiplier.ai's Narrative OS transforms strategic messaging into custom AI, allowing businesses to measure key metrics like CAC (customer acquisition cost), conversion rates, and LTV in real time.
Real-world examples highlight the impact of these tools. Allergan used Twilio Segment to analyze visitor engagement and deliver personalized offers, resulting in a 41% drop in CPA and generating $400 million in yearly sales. Similarly, Domino's utilized advanced tracking tools to create hyper-targeted audiences, achieving a 700% jump in ROAS and cutting cost per acquisition by 65%. These cases underscore how the right tracking infrastructure can directly influence critical business outcomes.
Conclusion
Tracking these 10 metrics transforms omnichannel segmentation into a reliable driver of growth. By focusing on lead-to-opportunity conversion, cross-channel performance, and segmented LTV, you can break down data silos that often disrupt customer experiences and inflate budgets. The results speak for themselves: marketers using three or more channels achieve a 287% higher purchase rate compared to those relying on single-channel campaigns. Similarly, companies with well-executed omnichannel strategies retain 89% of their customers, compared to just 33% for those with weaker integration.
These metrics address some of the biggest challenges in marketing. For instance, lowering CAC becomes possible when you pinpoint which channels actually influence decisions instead of relying on last-click attribution. GlowSkin, for example, used journey-based tracking to boost cross-channel conversions by 28% while cutting CAC by 14%. Higher conversion rates come from identifying and resolving friction points in the customer journey, while increased LTV naturally follows when you prioritize the top 20–40% of customers who contribute 60–80% of revenue.
"You can't master omnichannel retail until you learn how to measure it. Only by unifying your data and analyzing how every channel is working alongside and in tandem with each other can you begin to genuinely understand and engage your customers." - Lexer
This data-driven approach sets the stage for smarter, more agile marketing strategies. Shifting focus from vanity metrics to impact metrics like pipeline contribution sharpens forecasting and accelerates growth. Companies leveraging advanced analytics to track omnichannel performance report 15–20% higher ROI on their marketing investments. Additionally, well-integrated strategies can increase customer lifetime value by 30% or more. For those looking to bridge the gap between brand and performance marketing, tools like BrandMultiplier.ai's Narrative OS help standardize strategic messaging across teams while tracking its real-time impact on CAC, deal speed, and LTV.
To keep your strategy aligned with revenue goals, consolidate your data, standardize naming conventions, implement multi-touch attribution, and review metrics regularly. By tying segmentation efforts directly to these metrics, you can create an omnichannel strategy that drives targeted, efficient growth. When you focus on measuring what truly matters, growth becomes less of a guessing game and more of a certainty.
FAQs
What are the top 3 metrics to prioritize first?
The three most important metrics to focus on are customer lifetime value (LTV), engagement rate, and conversion rate. These key indicators play a crucial role in evaluating the effectiveness of your omnichannel strategy and offer a solid basis for tracking performance and driving growth.
How do I unify cross-channel data without a full data team?
To bring together data from different channels, consider using tools that combine customer interactions from platforms like online stores, social media, and email. These tools offer real-time insights and are designed to be user-friendly, so you don't need advanced technical skills to use them effectively.
Pay attention to key metrics such as engagement rates, multi-touch attribution, and customer satisfaction. Platforms with automated reporting and analytics can make the process even smoother, helping you consolidate data efficiently without relying on a full data team.
What attribution model should I use for pipeline contribution?
When it comes to understanding pipeline contribution, a full-funnel attribution model works well. It assigns credit to multiple touchpoints throughout the customer journey, giving a clearer picture of how different channels contribute to awareness, engagement, and conversions.
Another option is a multi-touch attribution model, such as linear, time decay, or position-based. These models show how various interactions combine to drive pipeline growth. Pairing these approaches with tools like BrandMultiplier.ai’s Narrative OS can help refine and improve your outcomes.
Ready to transform your brand story?
Schedule a free diagnostic to see how we can help.
Schedule The Diagnostic