
How Predictive Analytics Improves Conversion Forecasting
How Predictive Analytics Improves Conversion Forecasting
Predictive analytics helps businesses forecast customer conversions by analyzing past data and customer behavior. For small and mid-sized businesses (SMBs), this means smarter marketing decisions and better resource allocation. Here's why it matters:
- Improved Marketing Efficiency: Pinpoint effective channels, reduce ad waste, and prioritize high-value leads.
- Better Customer Targeting: Segment audiences based on behavior to send timely, personalized offers.
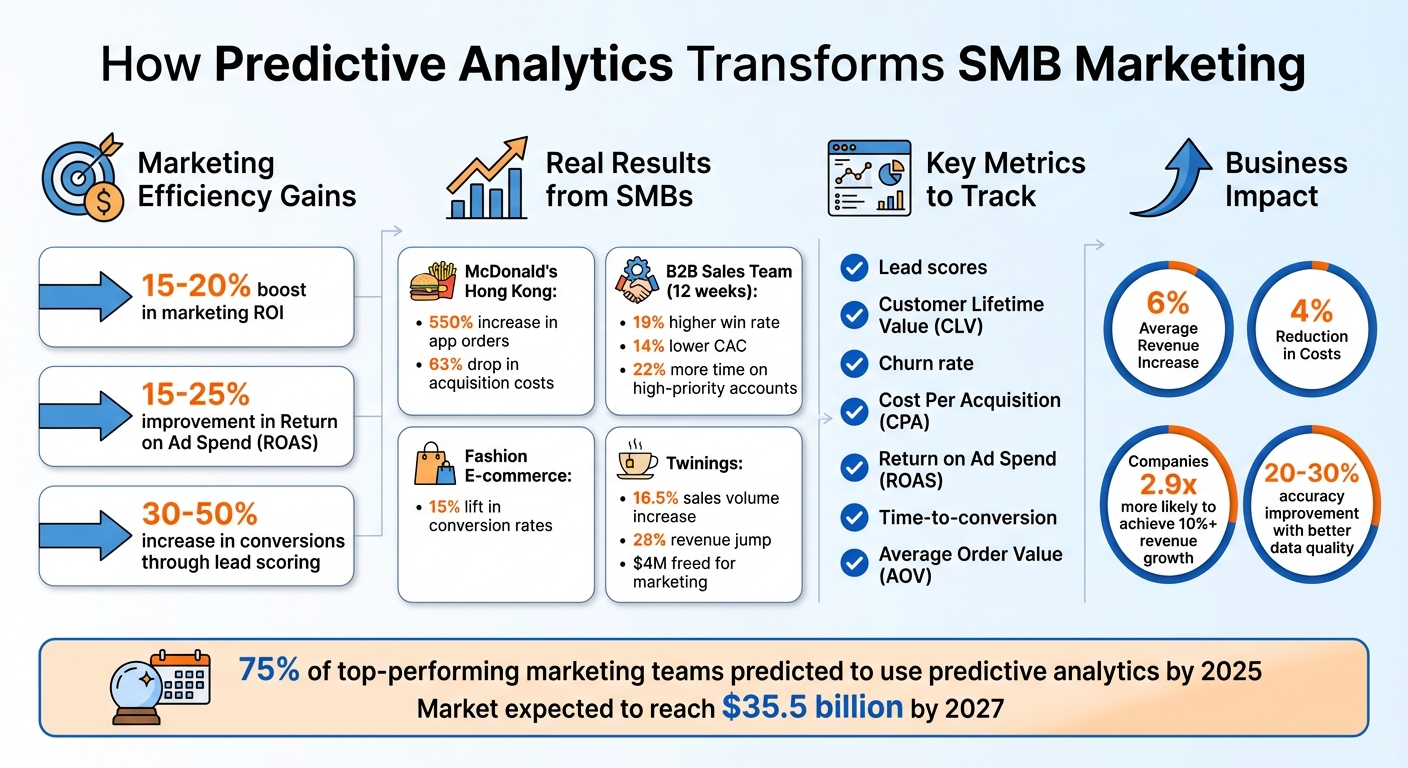
- Higher ROI: Businesses using predictive tools report a 15–20% boost in marketing ROI and up to a 50% increase in conversions.
To get started, clean your data, choose the right metrics (like churn rate or lead scores), and use tools like Google Analytics 4 or HubSpot. Predictive analytics isn't just for large enterprises anymore - SMBs can achieve measurable growth by adopting these techniques.
Predictive Analytics ROI and Conversion Impact for SMBs
Key Benefits for SMBs
Better Marketing Efficiency
Predictive analytics helps SMBs get the most out of their marketing budgets by eliminating wasted spending on campaigns that don't deliver. Instead of guessing which channels might work, predictive models pinpoint the ones that actually drive conversions. This allows businesses to adjust their spending mid-campaign, doubling down on what works and cutting back on what doesn’t. The result? Less wasted ad spend and better targeting of audiences who are more likely to buy.
The numbers back this up. Businesses that use predictive analytics see a 15–20% boost in marketing ROI and a 15–25% improvement in Return on Ad Spend (ROAS). For SMBs working with tight budgets, these improvements can be the difference between just scraping by and achieving real growth.
Another major advantage is lead scoring. Predictive models automatically identify high-value prospects and route them directly to the sales team. This means sales reps spend their time on leads that are most likely to convert, rather than chasing cold prospects. On average, this approach increases conversions by 30–50%. For instance, one B2B sales team used predictive models to improve their SDR routing and saw their win rate jump 19%, while their customer acquisition cost (CAC) dropped by 14% in just 12 weeks. On top of that, SDRs were able to shift 22% of their time to high-priority accounts.
These efficiency gains pave the way for even more precise customer targeting.
Improved Customer Targeting
Once your spending is optimized, predictive analytics takes customer targeting to a whole new level. These models analyze customer behavior in ways that would be impossible to do manually, automatically segmenting your audience into groups like "likely to buy soon" or "at risk of leaving." Using data like browsing history, email engagement, and purchase patterns, you can send perfectly timed, tailored offers.
Why does this matter? Because generic messaging doesn’t convert well. If you know a customer is likely to make a purchase in the next week, you can send them a timely offer that pushes them to act. If someone looks like they might churn, you can intervene with a retention deal - which is far cheaper than trying to win over a new customer.
Take McDonald's Hong Kong as an example. In 2024-2025, they used Google Analytics 4’s predictive audience tools to target users "likely to purchase soon." By optimizing bids for these segments in real-time, they saw app orders surge by 550% and their cost per acquisition drop by 63%. Even smaller-scale efforts deliver results. A fashion e-commerce retailer saw a 15% lift in conversion rates simply by using predictive models to trigger targeted prompts.
Higher Conversion Rates and ROI
Predictive analytics doesn’t just help you figure out who to target - it also tells you the best way to engage them. By analyzing your data, these models suggest the optimal next steps for driving conversions. Should you offer a discount? If so, how much? What’s the best time to reach out? What type of messaging will resonate most? Predictive analytics answers these questions, helping businesses tailor their approach for maximum impact.
Twinings is a great example of this in action. In January 2026, they partnered with Keen to use a Bayesian model to forecast the financial impact of their digital, online, and trade channels. The results were impressive: a 16.5% increase in sales volume, a 28% jump in revenue, and an additional $4 million freed up for marketing investments.
For SMBs, the broader trends are encouraging. Companies using predictive analytics report an average revenue increase of 6% and a 4% drop in costs. Even Fortune 500 companies, with all their resources, only slightly outpace these results with a 5% revenue bump and a 3% cost reduction. This shows that predictive analytics is leveling the playing field, giving smaller businesses the tools to compete with much larger organizations.
sbb-itb-63525a7
Forecasting with Predictive Analytics
Preparing Your Data
Before diving into forecasting conversions with predictive analytics, it’s essential to start with clean, complete data. Think of data quality as the backbone of any successful predictive model. If your data is flawed or incomplete, your predictions will likely follow suit. As Glenford Scott, Founder & Director of Ikonik Digital, puts it:
Data quality is key. Use reliable data sources to ensure accuracy... Quality data leads to better predictions.
Identifying the Right Conversion Metrics
When selecting metrics, focus on 5–8 key ones that align with your business objectives. For most small to medium-sized businesses (SMBs), these often include:
- Sales funnel conversion rates
- Lead scores
- Time-to-conversion
- Customer Lifetime Value (CLV)
- Average Order Value (AOV)
- Churn rate
- Behavioral triggers (like product page views or "add to cart" events)
- Financial metrics such as Cost Per Acquisition (CPA) and Return on Ad Spend (ROAS)
These metrics provide a well-rounded view of customer behavior and financial performance, making them ideal for predictive models.
Collecting and Cleaning Historical Data
After selecting your metrics, the next step is gathering historical data. Pull this information from reliable sources like your CRM system, web analytics tools (e.g., Google Analytics 4), ad platforms, email marketing software, and social media . For example, Google Analytics 4 requires at least 1,000 positive and 1,000 negative examples (like purchasers versus non-purchasers) within a 28-day window to effectively train predictive models.
Once collected, focus on cleaning the data. This involves removing duplicate entries, fixing inconsistencies (e.g., mismatched naming conventions or incorrect values), and addressing missing data - either by correcting errors or removing incomplete entries . Make sure to standardize formats, such as using MM/DD/YYYY for dates and the U.S. dollar ($) for currency, so your model can interpret the data correctly. As Improvado emphasizes:
Predictive modeling only performs as well as the data behind it.
Once your data is clean, integrate it into a unified system for a more comprehensive view of your customer base.
Integrating Data Sources
The final step is bringing all your refined data together. Combine data from your CRM, website analytics, email campaigns, social media platforms, and accounting tools (like QuickBooks) into a single dataset . This consolidated view allows you to see the entire customer journey, rather than fragmented pieces.
To make this happen, map customer identifiers across platforms - for instance, linking an email address in your CRM to a website cookie. Additionally, standardize UTM parameters across marketing channels like Facebook, Instagram, and LinkedIn to maintain consistent performance tracking. Automating this integration process with trusted tools can help reduce manual errors and ensure your dataset stays current.
Step-by-Step Implementation Guide
With your data ready and integrated, it's time to bring predictive analytics into your marketing strategy. A structured approach ensures you go from selecting tools to applying insights in your campaigns effectively.
Step 1: Choose Your Predictive Analytics Tool
The first step is deciding whether to build custom models or use an existing platform. For most small and mid-sized businesses (SMBs), this choice depends on budget, data volume, and technical expertise.
Start by ensuring your data meets basic requirements. For example, platforms like Google Analytics 4 (GA4) have minimum thresholds for data volume. If your traffic is below these levels, you might need to grow your audience first or explore alternative tools.
Budget plays a big role here. If your marketing spend is under $5,000 per month, free features like GA4’s predictive audiences are your best bet. For budgets between $5,000 and $50,000, platforms like HubSpot or Salesforce Einstein provide automated modeling without requiring a dedicated data science team. To give you an idea of costs, Matomo Analytics starts at $26 per month, while Heap offers a free plan for up to 10,000 monthly sessions.
Integration is another key factor. Make sure the tool connects seamlessly with your CRM, e-commerce platform, and ad systems. Before committing, test the platform during a trial period to confirm it can address your specific challenges.
"Anchor your roadmap to operating change so models drive actions in sales, media, and product - not just reports".
The tool you choose should address a clear business question, such as, "Which leads should our sales team call first?" or "What discount will best prevent churn?" This focus ensures your investment leads to actionable insights, not just more dashboards.
Once you've selected your tool, you're ready to build and train your models.
Step 2: Build and Train Your Models
With your tool in place, the next step is creating models tailored to your goals. Start by defining your objective clearly. Are you predicting which leads will convert in 90 days? Or identifying customers likely to churn within 60 days? A well-defined goal improves model performance.
Next, identify the features - or input variables - that influence your outcome. These could include marketing campaign data (like UTM parameters), firmographic details (such as company size or industry), behavioral signals (e.g., pages viewed or emails opened), and purchase history. Focus on stable, reliable features rather than metrics that fluctuate frequently.
Split your data into training (70-80%) and testing (20-30%) sets. This ensures your model is tested rigorously before deployment.
Choose the right algorithm for your goal. For yes/no questions (e.g., "Will this lead convert?"), use classification models like logistic regression. For numerical predictions (e.g., "How much will this customer spend?"), opt for regression models. For trends over time, go with time-series forecasting. Experts often recommend starting with interpretable models like logistic regression or Gradient Boosting Machines before experimenting with more complex AI.
Here’s a real-world example: In 2025, McDonald’s Hong Kong used GA4’s predictive audiences to target users likely to purchase soon. By training models on app behavior and optimizing bids for high-propensity segments, they saw a 550% increase in app orders and a 63% drop in acquisition costs.
Avoid target leakage. This happens when your model uses data that wouldn’t actually be available at decision time. For instance, if you're predicting whether someone will place an order, don't include a "delivery date" column in your training data. Such errors can make your model appear flawless during testing but fail in real-world scenarios.
Once your model is trained, the next step is thorough testing.
Step 3: Test and Refine Your Models
Testing helps confirm whether your model performs as expected in real-world scenarios. Compare its predictions to actual outcomes.
Check your model's health score. For example, platforms like Amplitude consider a model usable if its health score - based on data quality and accuracy - is above 70%. If your score is lower, you may need more data, better features, or cleaner inputs.
Use cross-validation to ensure consistent performance across different time periods or customer groups. Monitor the model’s performance regularly and retrain it monthly or quarterly to counteract data drift.
Set up a control group in your campaigns. For example, if your model predicts a discount will boost conversions, test this by holding back a group of users from receiving the discount. This approach reveals the actual lift in conversions, not just correlations. As The Pedowitz Group emphasizes:
"Success is measured in lift and adoption, not AUC alone".
One B2B team applied propensity models for sales routing and uplift models for paid social offers. Over 12 weeks, they achieved a 19% increase in win rates, a 14% reduction in acquisition costs, and shifted 22% more sales time to high-priority accounts.
Once your model proves accurate, integrate its insights into your marketing efforts.
Step 4: Apply Predictions to Marketing Campaigns
Put your model to work by integrating its predictions into your operational systems. For instance, push lead scores into your CRM so sales teams can prioritize high-value prospects. Use churn risk alerts in your marketing automation platform to trigger retention campaigns. Export high-value audience segments to platforms like Google Ads and Facebook for automated bidding.
Here’s how it works: If a model predicts an 80% chance of churn within 30 days, trigger a personalized win-back campaign. If a lead shows high purchase intent, route them directly to your sales team instead of keeping them in a generic nurture track.
Real-time updates are especially useful during critical periods like Black Friday or product launches. For example, Chick-fil-A used predictive analytics to enhance their mobile app. By identifying users likely to order delivery, they moved the delivery button to the app’s main screen, resulting in a 23% increase in delivery orders.
Finally, track performance against your original goals. For instance, if your aim was to lower customer acquisition costs, compare CAC before and after implementing the model. If improving conversion rates was the goal, measure the lift in conversions among high-intent users versus your baseline. Use this feedback to fine-tune your campaigns and maximize results.
Measuring Success and Avoiding Mistakes
Once you've implemented a predictive model, the next step is ensuring it performs as expected and addressing any issues promptly.
Checking Forecast Accuracy
To gauge how well your model is performing, start by splitting your historical data - 80% for training and 20% for validation. This lets you compare your model's predictions to actual outcomes.
Here are some key metrics to track and what they reveal:
| Metric | What It Measures | When to Use It |
|---|---|---|
| Accuracy | The percentage of correct predictions overall | Use when false positives and false negatives have equal costs |
| Precision | The proportion of predicted conversions that actually converted | Best when acting on false leads is costly |
| Recall | The proportion of actual conversions the model identified | Use when missing potential conversions is expensive |
| F1 Score | A balance between precision and recall | Ideal for rare conversion events or unbalanced datasets |
| MAPE | The average percentage deviation between forecasted and actual values | Useful for tracking volume forecast errors |
For small and medium-sized businesses, the F1 Score is especially helpful since conversions are often rare compared to non-conversions. While traditional forecasting methods typically achieve 70–79% accuracy, AI-driven tools can boost this by as much as 30%.
To maintain sustained accuracy, monitor metrics like the F1 Score regularly. Customer behaviors shift over time, so a model trained months ago might not reflect current trends. Establish a retraining schedule - monthly or quarterly - to keep predictions relevant. As Alex Zlotko, CEO of Forecastio, puts it:
"Machine learning sales forecasting reduces rep-driven bias - such as overconfidence or sandbagging - by relying on objective data instead of subjective judgment. This leads to more accurate forecasting and better resource allocation".
Compare your predictions against actual month-end results. If you notice discrepancies, calculate the variance to pinpoint areas for improvement. A drop in accuracy signals it’s time to retrain with updated data.
Once you're confident in your forecast accuracy, shift focus to measuring its business impact.
Calculating Your ROI
To measure ROI, you need to assess both technical performance and its effect on your business. These financial metrics can help:
- Customer Acquisition Cost (CAC): Compare CAC before and after using predictive models. Improved targeting should lower costs per customer.
- Conversion Rate Uplift: Track the percentage increase in conversions among high-intent users versus your baseline.
- Customer Lifetime Value (LTV): Use predictions to identify high-value customers and allocate resources accordingly.
- Time Savings: Quantify the hours saved by automating tasks like lead scoring or campaign optimization.
For example, in 2024, a retail e-commerce company with over 300 employees implemented Pecan's predictive upsell model. By analyzing 100,000 leads daily and enriching CRM data with sociodemographic information, the company boosted its conversion rate from 7% to 12% - a 71% increase - in just two weeks. Additionally, the sales team saw a 20% jump in call answer rates.
To measure the true impact of your model, use holdout groups. For instance, if your model targets a specific customer segment, exclude a control group from the campaign. Compare conversion rates between the targeted and control groups to gauge the actual lift your predictions provide.
While tracking performance metrics is essential, addressing common pitfalls is equally important to ensure your model's effectiveness.
Common Problems and Solutions
Even a well-designed model can fail if you overlook certain challenges. Here’s what to watch out for and how to address it:
-
Data quality issues: Inaccurate CRM data - such as missing fields, outdated contacts, or inconsistent pipeline stages - can lead to unreliable forecasts.
Fix: Make key fields like close date, deal amount, and stage mandatory in your CRM. Use automated tools to flag errors and clean up duplicates weekly. - Overfitting: When the model learns noise instead of patterns, its predictions become unreliable. Start with simpler models like logistic regression and use cross-validation to ensure consistency.
-
Neglecting model use: Some teams generate predictions but fail to integrate them into campaigns.
Fix: Push lead scores into your CRM for sales routing and export high-priority audiences to ad platforms for automated bidding. -
Data silos: Isolated data across systems prevents the model from having a complete customer view.
Fix: Invest in integrations that connect your CRM, e-commerce platform, and marketing tools before building models. -
Relying on gut feelings: Bias creeps in when decisions are based on intuition rather than data. Only 45% of sales leaders trust their current forecasts.
Fix: Standardize your forecasting process around model outputs. Use the model to prioritize leads, allowing sales reps to focus on closing deals.
Improving data quality alone can boost forecasting accuracy by 20–30%. Companies using predictive analytics are also 2.9 times more likely to achieve revenue growth of 10% or more. By addressing these challenges proactively, you can unlock the full potential of your predictive models and drive meaningful results.
Using Narrative OS for Better Forecasting
Predictive analytics can tell you who is likely to convert and when, but it often falls short of explaining why. This is where strategic storytelling steps in. By creating a brand message that connects on a deeper, neurological level, you can enhance the effectiveness of predictive models. When combined, these tools don't just predict behavior - they help shape it. Narrative OS acts as the bridge, integrating storytelling with your predictive analytics tools to deliver actionable insights.
How Narrative OS Works with Predictive Analytics
Narrative OS takes your core strategic story, grounded in neuroscientific principles, and embeds it across key areas like leadership, sales, product, and marketing. It doesn’t stop there - it continuously measures how your narrative impacts metrics like customer acquisition cost (CAC), deal speed, and lifetime value (LTV), refining the story in real time, quarter after quarter.
Here’s how it works: while predictive analytics identifies high-intent customer segments based on behavioral data, Narrative OS enhances those insights by delivering messaging tailored to resonate with each group. For instance, if clustering algorithms identify a segment like "Technical Evaluators" based on their browsing behavior, Narrative OS crafts messaging that aligns with their specific evaluation criteria, making your outreach more effective.
This system doesn’t just provide passive forecasts; it connects predictive insights with actionable strategies. Instead of simply knowing the likelihood of a conversion, you’ll understand which aspects of your narrative - whether it’s a value proposition, a proof point, or an emotional appeal - are driving that conversion. This transforms forecasting into a dynamic tool for growth, seamlessly linking brand messaging with performance metrics.
Connecting Brand and Performance Marketing
Traditionally, forecasting has treated brand and performance marketing as separate entities, often leaving gaps in strategy. Narrative OS challenges this siloed approach by uniting these functions, helping you create messaging that improves both user experience and conversion rates. Siobhan Solberg, Founder of Raze, sums it up perfectly:
AI is not just about automation - it's about elevation. It allows UX to adapt at the individual level while still optimizing for business goals.
Using real-time intent signals like scroll depth or hover behavior, Narrative OS adjusts messaging on the fly to reduce issues like cart abandonment. Companies that have implemented this type of personalization report impressive results, including a 2.5x boost in conversion rates and a 38% increase in engagement duration.
This approach shifts forecasting from focusing on isolated touchpoints to considering the entire customer lifecycle. As Eddie Cliff, Vice President and General Manager of Small Business at Salesforce, explains:
Financial forecasting isn't just about sales, it's about the entire customer lifecycle.
Conclusion: Growing Your SMB with Predictive Analytics
Predictive analytics offers SMBs a practical way to shift from reactive decision-making to proactive strategies. By applying the steps outlined here, you can confidently forecast conversions, allocate marketing budgets more effectively, and pinpoint high-value customers - potentially outpacing your competitors in the process.
Companies using predictive models have seen an average 10% revenue boost and a 20–25% improvement in operational efficiency. Julia Moreno from Dataslayer explains it well:
Predictive analytics transforms your historical campaign data, customer behavior, and market signals into reliable forecasts about what happens next. It's the difference between driving with GPS versus an outdated map.
To get started, focus on one specific application - such as lead scoring, reducing churn, or optimizing budget allocation. Begin by cleaning your data, setting clear KPIs tied to metrics like CAC (Customer Acquisition Cost) and LTV (Lifetime Value), and testing your models against historical data. You don’t need an advanced degree to make it work - tools like Google Analytics 4 and many CRMs already offer built-in predictive features.
As highlighted earlier, a structured, step-by-step approach is key to consistent growth. With the predictive analytics market expected to hit $35.5 billion by 2027 and 75% of top-performing marketing teams predicted to use these tools by 2025, the opportunity is undeniable. The real question is whether you’ll adopt predictive analytics before your competitors do. Done right, it can transform conversion forecasting from guesswork into a reliable growth strategy for your SMB.
FAQs
How much data do I need to start forecasting conversions?
The size of the dataset you need hinges on two factors: the complexity of your predictive model and the quality of your historical data. For simpler models, 100 to 1,000 data points might be sufficient, as long as they capture the essential patterns. However, more complex models typically demand much larger datasets, often covering months or even years, to deliver reliable results. To ensure accurate conversion forecasts, make sure your historical data is both clean and representative of the trends you're analyzing.
Which conversion metrics matter most for my business?
The most important conversion metrics can vary depending on your goals and industry, but a few stand out as universally important:
- Conversion Rate: This metric measures how effectively potential customers are turning into actual buyers. It's a direct indicator of how well your strategies are working to drive actions.
- Time-to-Conversion: This tracks the time it takes for a prospect to become a customer. Understanding this can help you streamline your sales process and reduce delays.
- Customer Lifetime Value (LTV): LTV measures the total revenue a customer brings over their entire relationship with your business. It’s essential for shaping retention strategies and identifying upselling opportunities.
To make the most impact, focus on metrics that align with your specific objectives - whether that’s driving more sales, boosting efficiency, or improving your return on investment (ROI).
How do I turn predictions into real campaign actions?
To make predictions work for your marketing efforts, you need to integrate them seamlessly into your workflows. Begin by clearly identifying your business goals and the KPIs that align with them. Once that's set, rely on clean, accurate data and choose models that fit your needs, such as propensity models or lifetime value models.
Next, put those predictions to work by activating them in tools you already use - like CRMs or ad platforms. From there, automate actions based on the insights you’ve generated. For example, you can create targeted campaigns or personalized offers.
Finally, keep a close eye on how these predictions are performing. Regularly retrain your models to ensure they stay accurate and continue to improve key metrics like conversions and ROI.
Ready to transform your brand story?
Schedule a free diagnostic to see how we can help.
Schedule The Diagnostic